Asa GangjeeFoundation build / Phase 01

Asa Gangjee

  • Propulsion engineer
  • Stanford ’30
  • Rocket engines: design, simulation, build, hot-fire
  • Foundation build, phase 01
View design tokens
00 / Status

Foundation build.

Palette, type, grid and motion tokens are live on this page. Projects, media and 3D models arrive in later phases.

Design token specimen

01 / Type

Hot-fire

display-xl - 120/1.04 - -0.04em - at >=960px

Regeneratively cooled

display-l - 100/1.10 - -0.03em - at >=960px

Designed, simulated, built

display-m - 72/1.08 - -0.03em - at >=960px

Designed, simulated, built

headline - 50/1.08 - -0.02em - at >=960px

Neutral placeholder words

title - 34/1.18 - -0.01em

Supporting copy sits under a headline.

lead - 24/1.30 - 0em

Body copy sample at eighteen pixels, running prose at a readable measure.

body - 18/1.40 - 0em

Interface chrome: buttons, labels, table cells

ui - 16/1.40 - 0em

Earmark sample 0123 / thrust peak - n

earmark - 10/1.60 - +0.05em - mono, uppercase

02 / Color

void

#0d0e10

ink

#1e2124

graphite

#2f3234

slate

#494a4b

ash

#636363

smoke

#767676

fog

#9b9b9b

mist

#b9b9b9

tile-light

#dbdbdb

band

#efefef

white

#ffffff

signal

#4e8af7

alert

#ff4136

03 / Grid
01
02
03
04
05
06
07
08
09
10
11
12
Label
Content

1440 max - 12 columns - gutter 32

04 / Hairlines and earmarks
113.27 NPeak thrust, Version 3 engine
$87.99Fabrication cost per engine
55%Wall temperature reduction, regeneratively cooled vs solid wall
6 trialsHot-fire trials across three engine versions

Asa Gangjee

Difference blend over media
05 / Media index
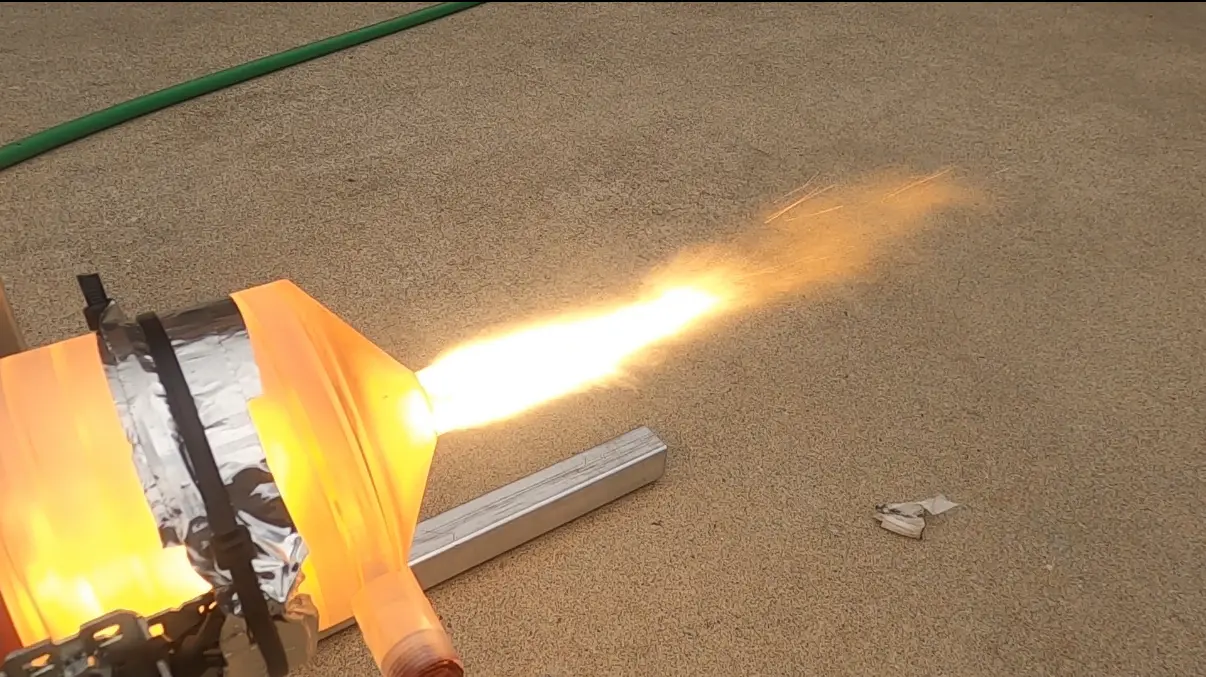
Bright orange exhaust plume leaving the foil-wrapped Version 3 aerospike engine over a tan floor during a hot-fire test
Version 3 aerospike engine exhaust plume at maximum mass flow rate during a hot-fire test.
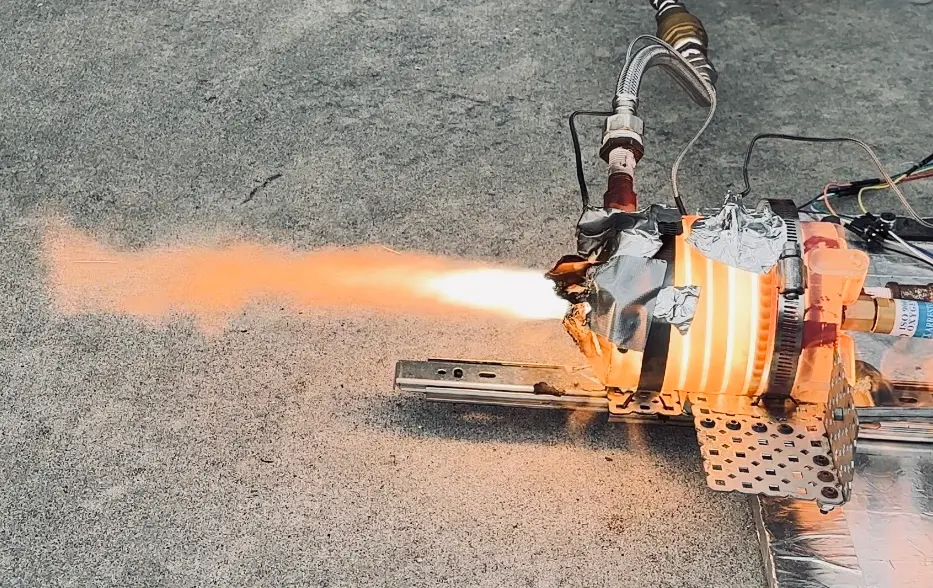
Orange flame streaming left from a resin engine wrapped in aluminum tape and clamped to a drawer rail on a gray concrete floor
Version 2 aerospike engine exhaust plume at maximum mass flow rate during a hot-fire test.
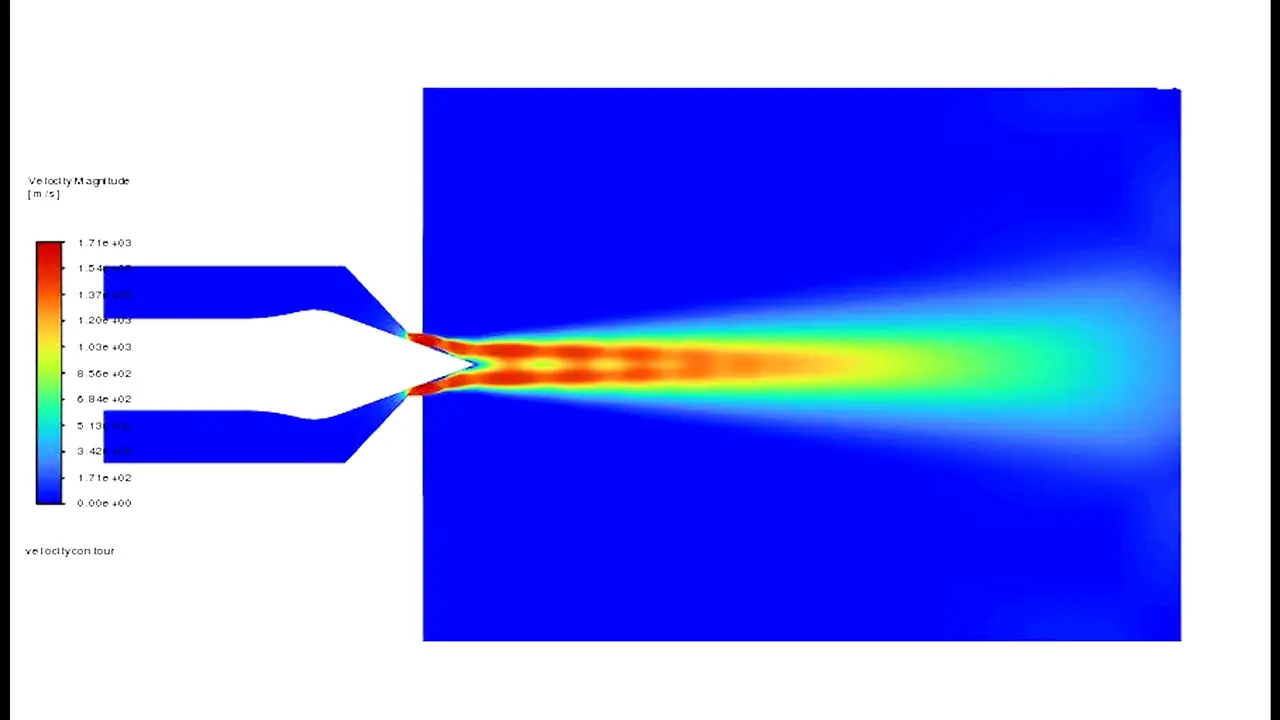
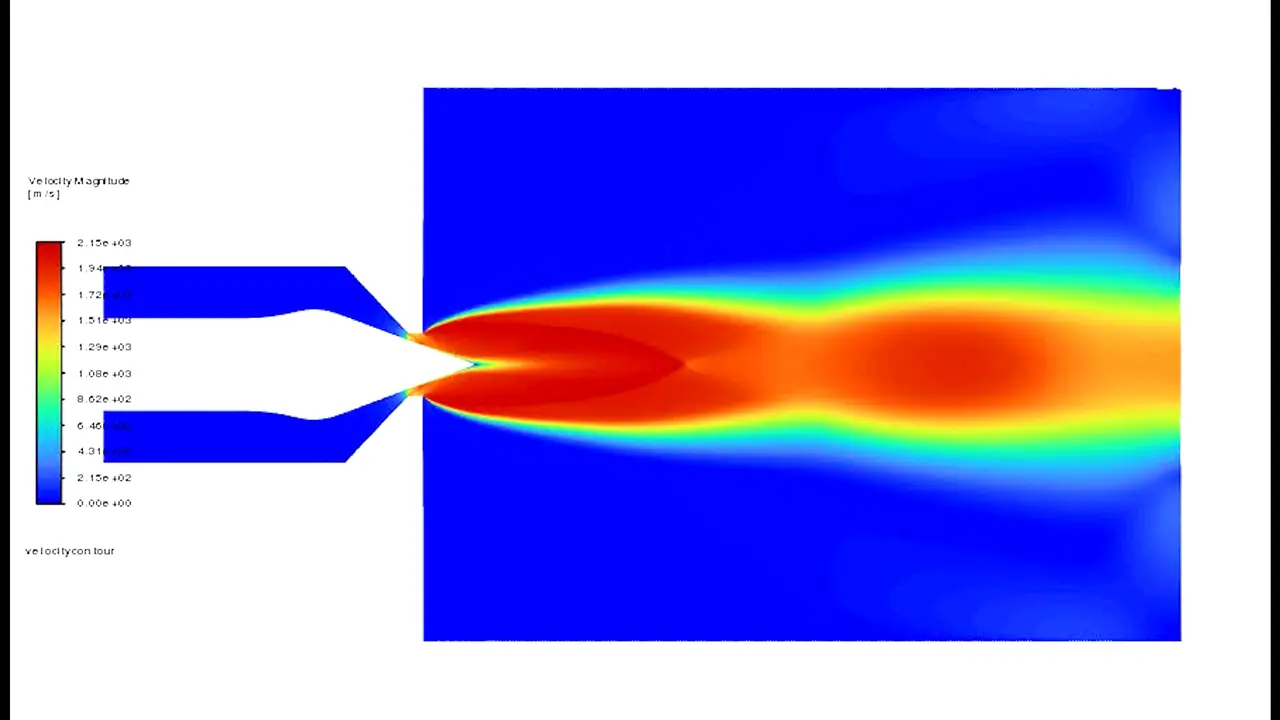
Velocity magnitude contour map of the aerospike exhaust, a narrow red and orange jet with repeating shock cells fading to blue and green downstream
Velocity magnitude contours of the final aerospike design at sea level (101,325 Pa ambient), from a two-dimensional planar k-epsilon simulation in ANSYS Fluent.
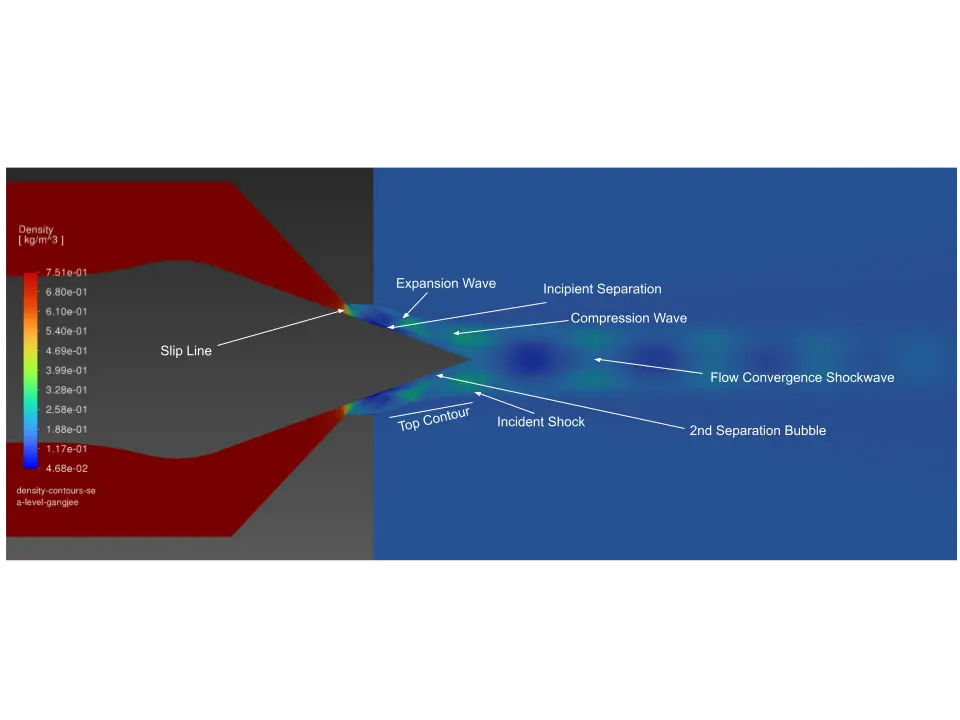
Density contour map of the aerospike plume with white arrows naming the expansion wave, incipient separation, slip line, incident shock and second separation bubble
Labeled density contours of the aerospike exhaust flow at sea level (101,325 Pa ambient), marking the expansion wave, separation points and shock structure.
Velocity magnitude contour map of the aerospike exhaust at altitude, a wide red core spreading into a broad orange and yellow plume
Velocity magnitude contours of the final aerospike design at 25 km altitude (2,511 Pa ambient), from the same two-dimensional k-epsilon simulation setup as the sea-level case.
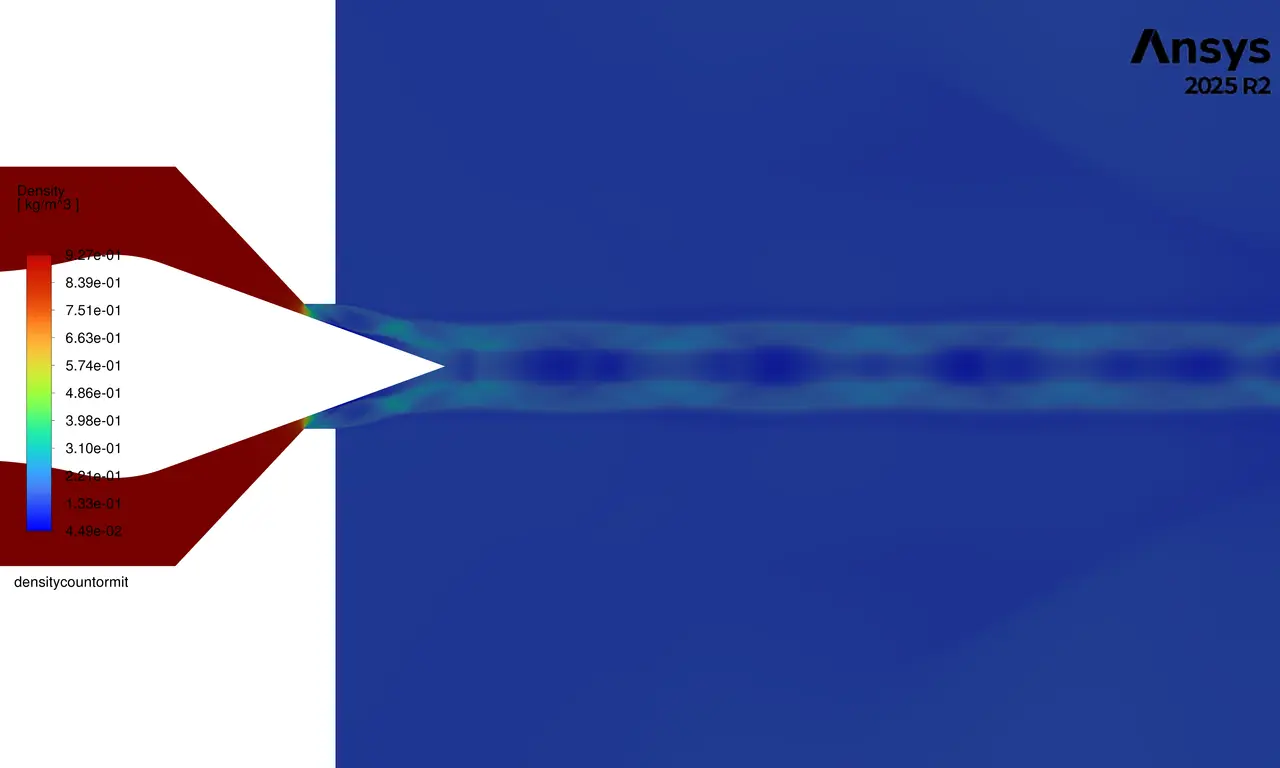
Density contour of the aerospike plume showing a thin chain of low density cells trailing behind the spike tip on a dark blue field
Density contours from the detached eddy simulation (DES) used to refine the shock boundaries seen in the k-epsilon runs.
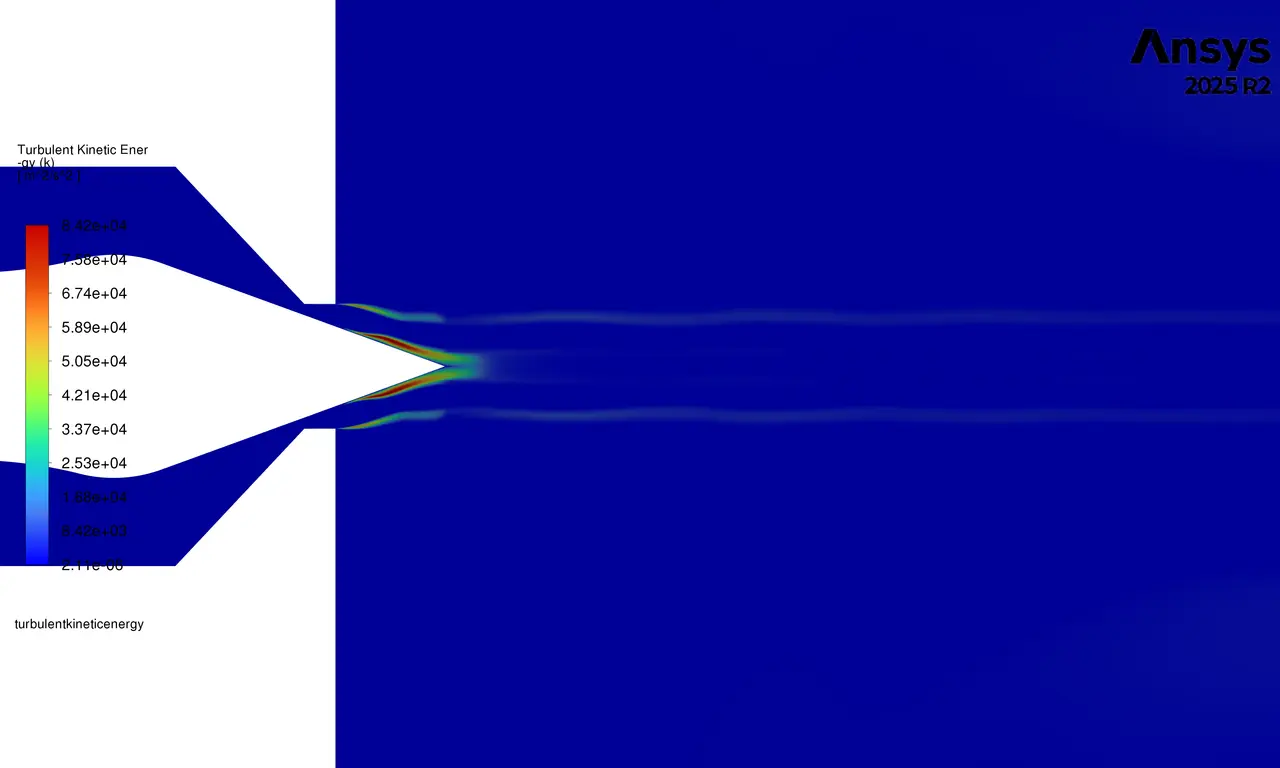
Turbulent kinetic energy contour with thin red and green streaks hugging the spike surface and faint shear layers trailing into the plume
Turbulent kinetic energy contours from the detached eddy simulation, concentrated along the spike surface and the shear layers of the plume.
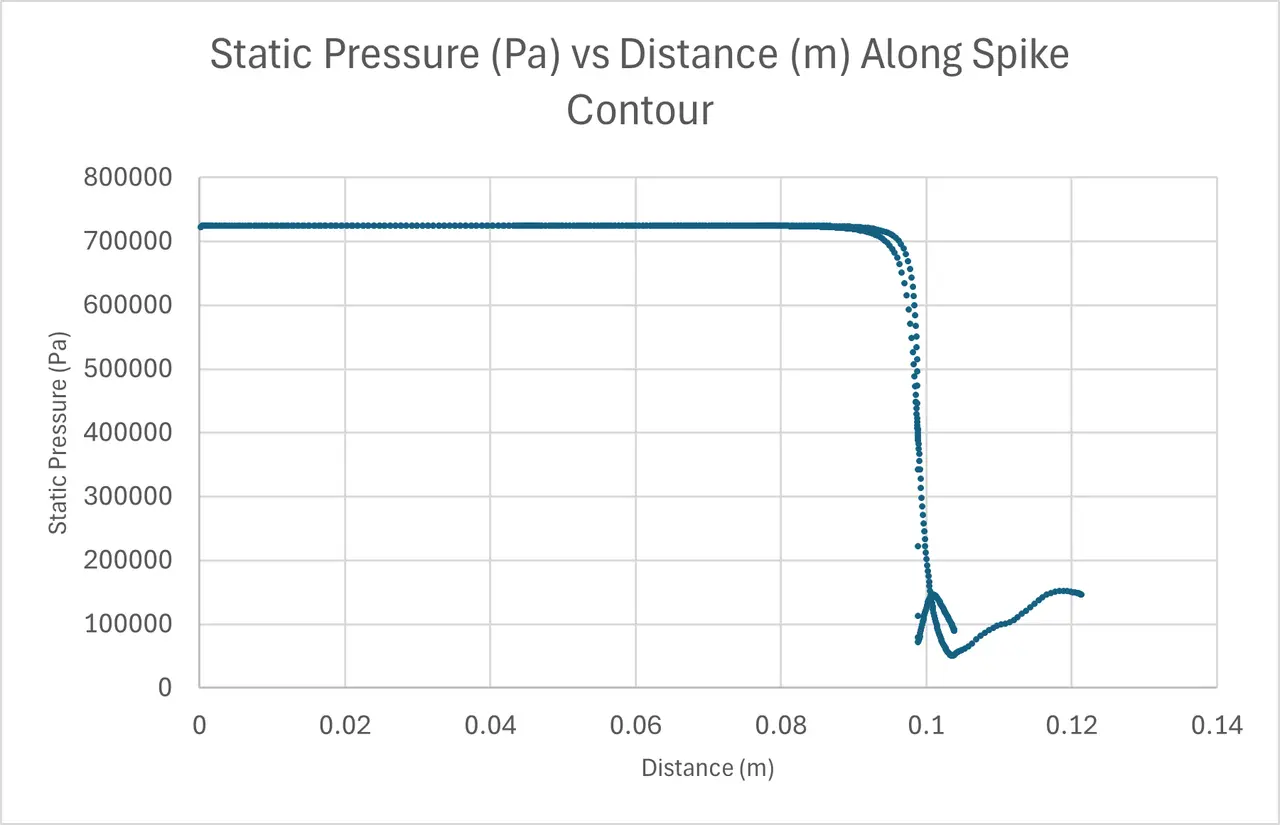
Scatter chart of static pressure in pascals against distance along the spike contour, a flat plateau near 700 thousand that drops sharply past 0.09 meters
Static pressure along the spike contour from the CFD solution: a plateau near the 723 kPa design chamber pressure, then a sharp drop where the flow separates.
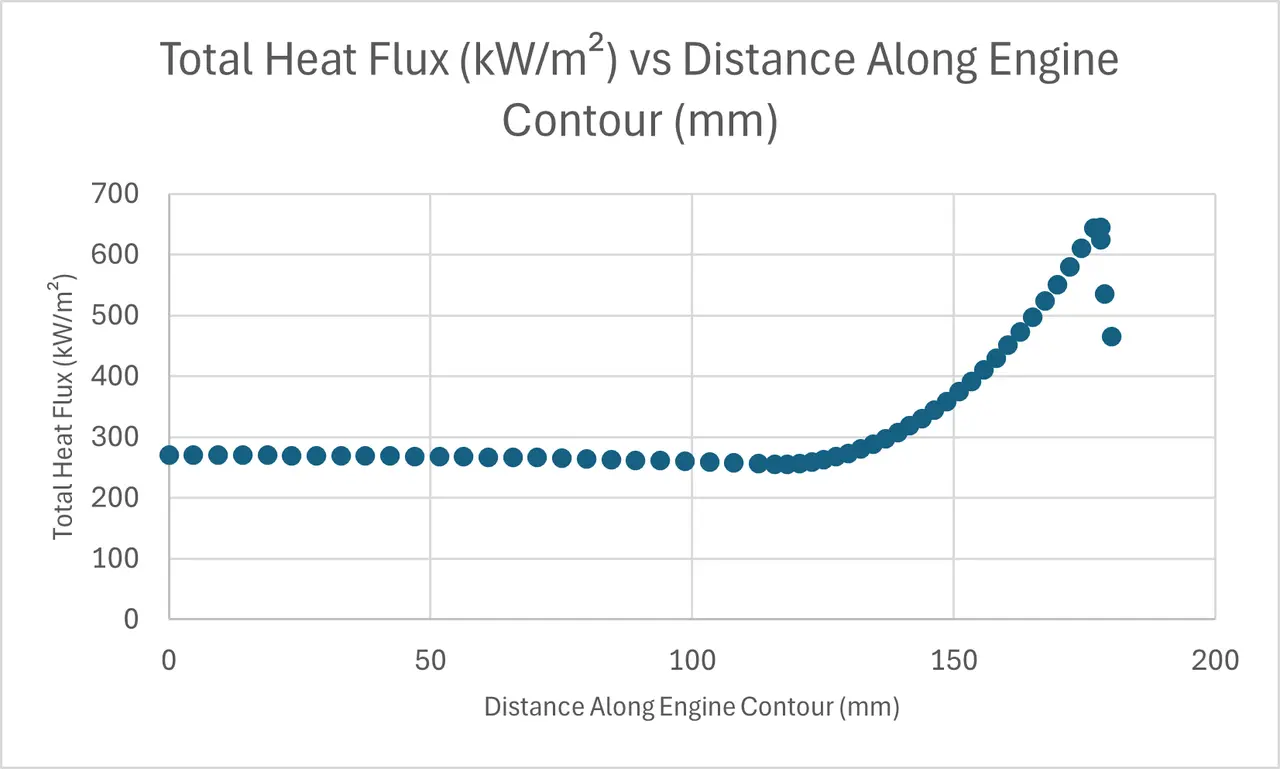
Scatter chart of total heat flux in kilowatts per square meter against distance along the engine contour, flat for most of the length then climbing steeply near the end
Total heat flux along the engine contour from the boundary-layer model (Rocket Propulsion Analysis), used to size the regenerative cooling channels.
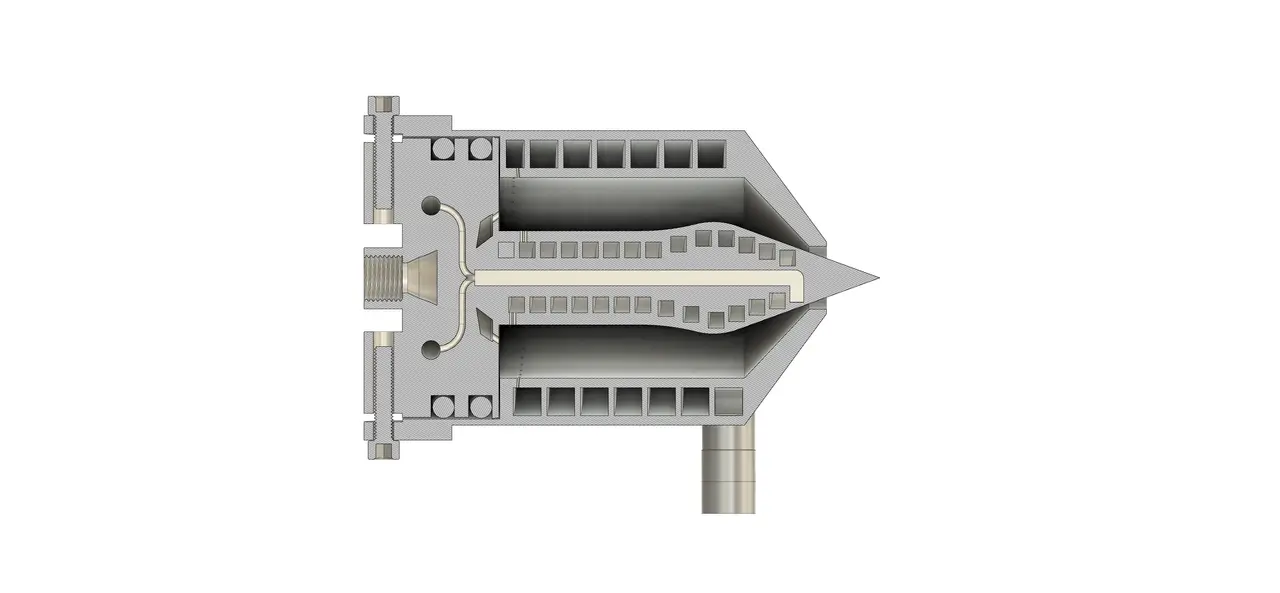
Gray CAD section view of the aerospike engine showing square spiral cooling channels in the spike and outer case around a central cavity
Fusion 360 cut-through of the regeneratively cooled aerospike engine, showing the square-walled spiral cooling channels in the spike and in the case.
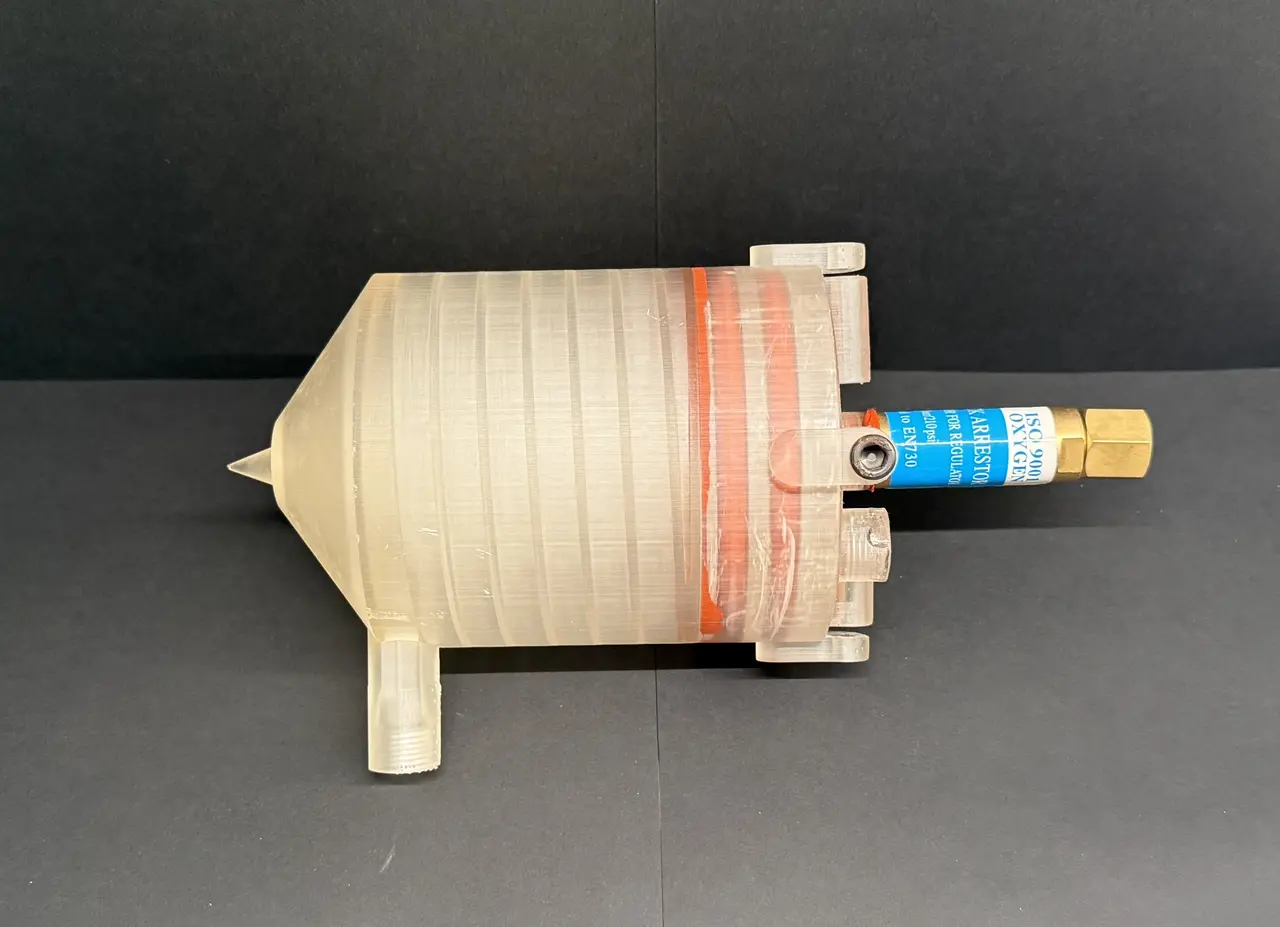
Translucent resin-printed aerospike engine lying on a dark surface with a conical spike nose, an orange seal ring and a blue-labelled brass fitting
The resin-printed aerospike engine photographed from the side: ribbed translucent body, spike nose, injector inlet and brass flashback arrestor fitting.
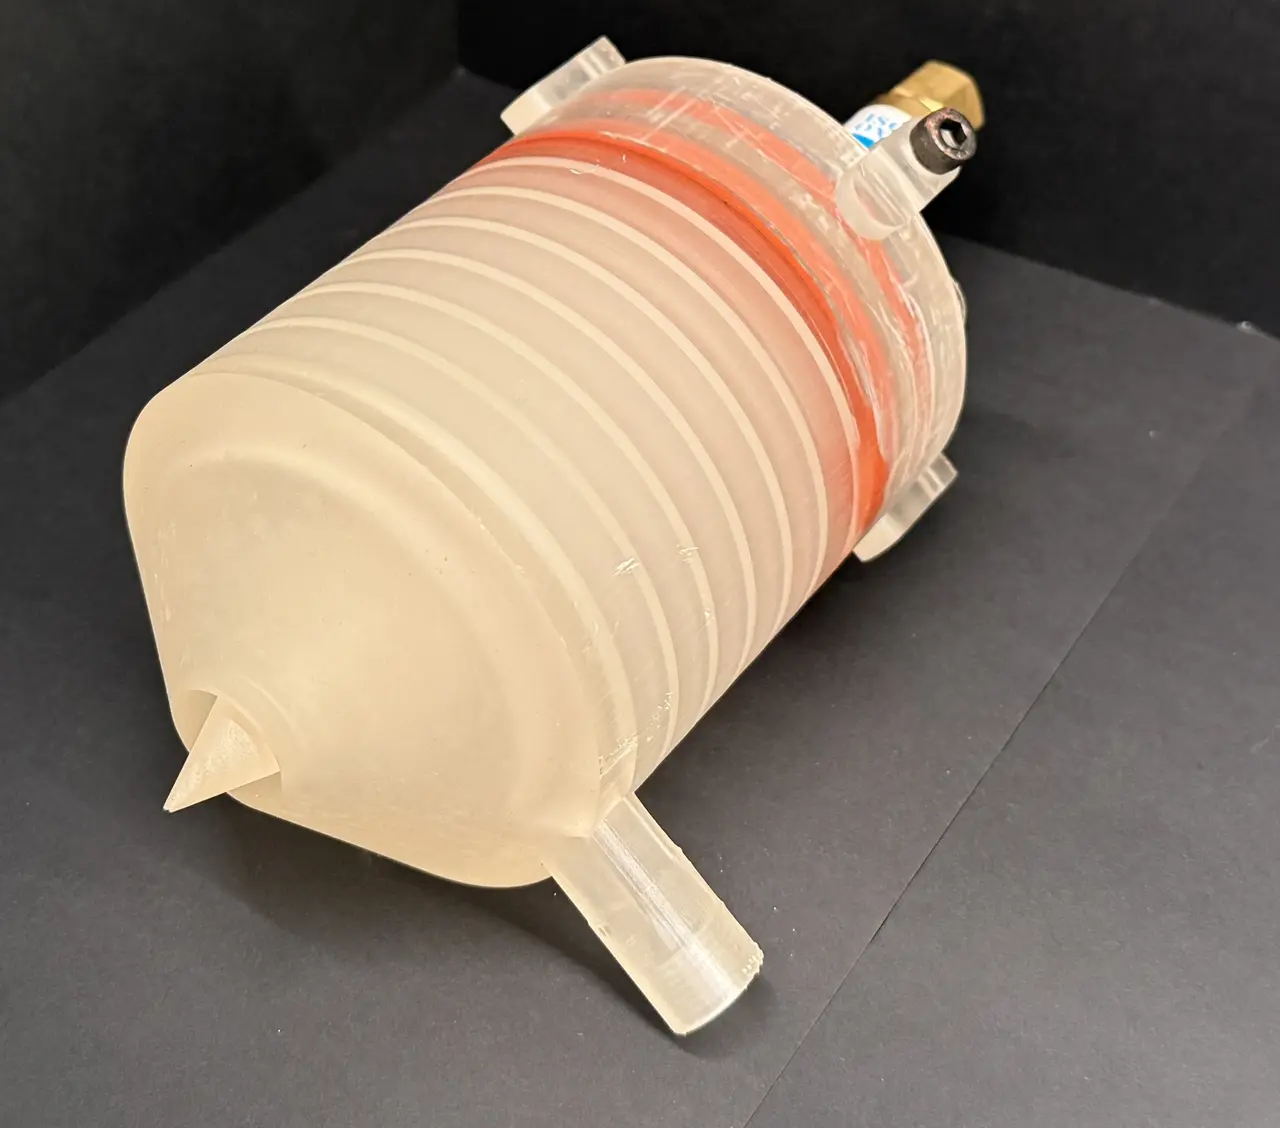
Translucent ribbed resin engine body seen from the nozzle end with the pointed spike in the foreground and a brass fitting at the far end
The resin-printed aerospike engine photographed from the nozzle end, showing the spike and the ribbed print layers of the case.
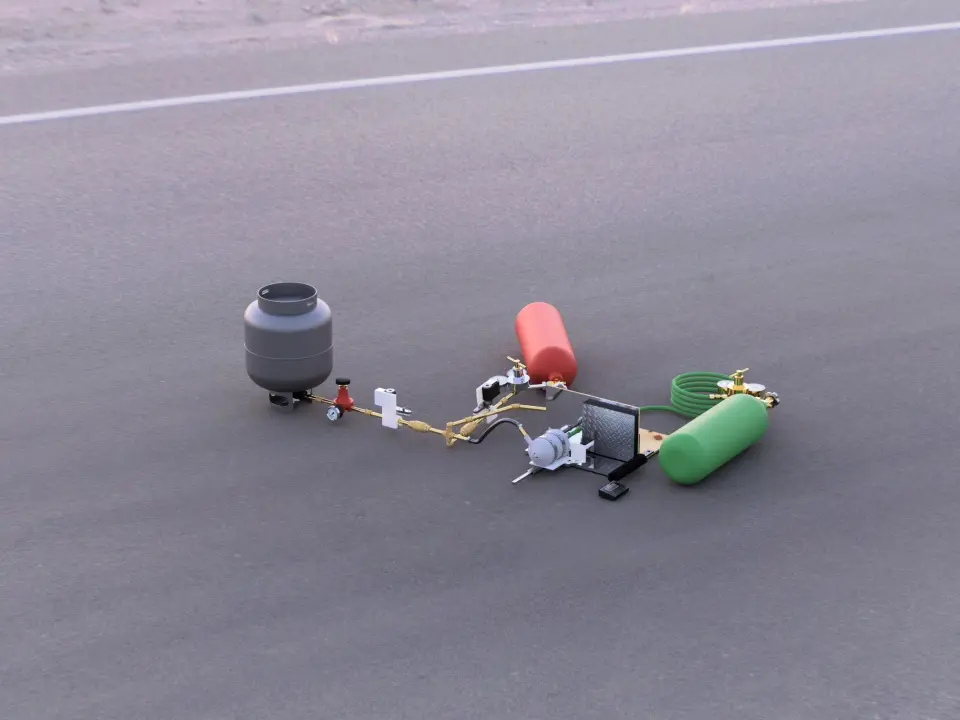
Rendered overview of the test site on asphalt with a propane cylinder, red and green gas cylinders, brass plumbing and the engine on a small panel stand
Render of the Version 1 test stand: an MDF panel stand holding the engine on a ball-bearing rail against a strain gauge, with propane, oxidizer and purge supply lines.
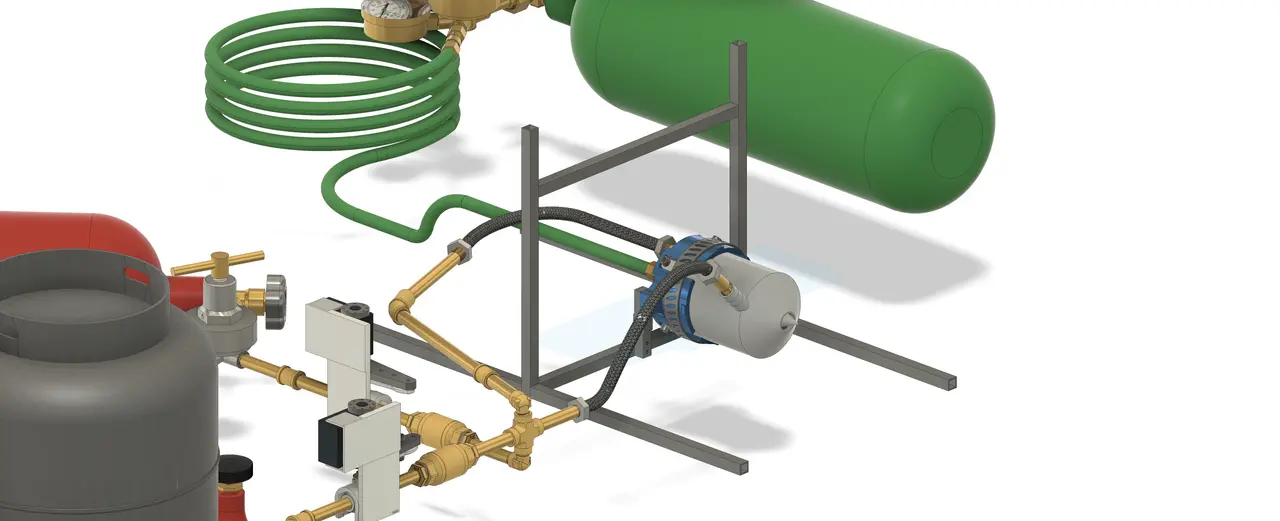
Rendered aluminum extrusion frame holding a blue clamped engine, braided hoses, brass plumbing, solenoid valves and a green oxygen cylinder
Render of the Version 2 test stand: an aluminum extrusion frame with the engine solidly mounted to a higher-capacity force sensor.
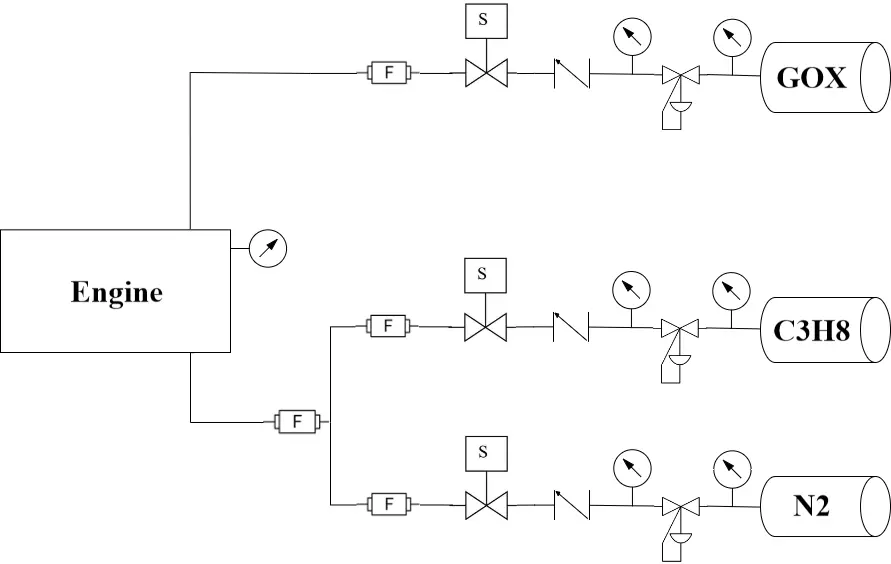
Black and white schematic with an engine box fed by three lines labeled GOX, C3H8 and N2, each with gauges, a regulator, a check valve and a solenoid valve
Plumbing diagram of the test stand: gaseous oxygen, propane and nitrogen purge lines, each regulated, metered and valved into the engine.
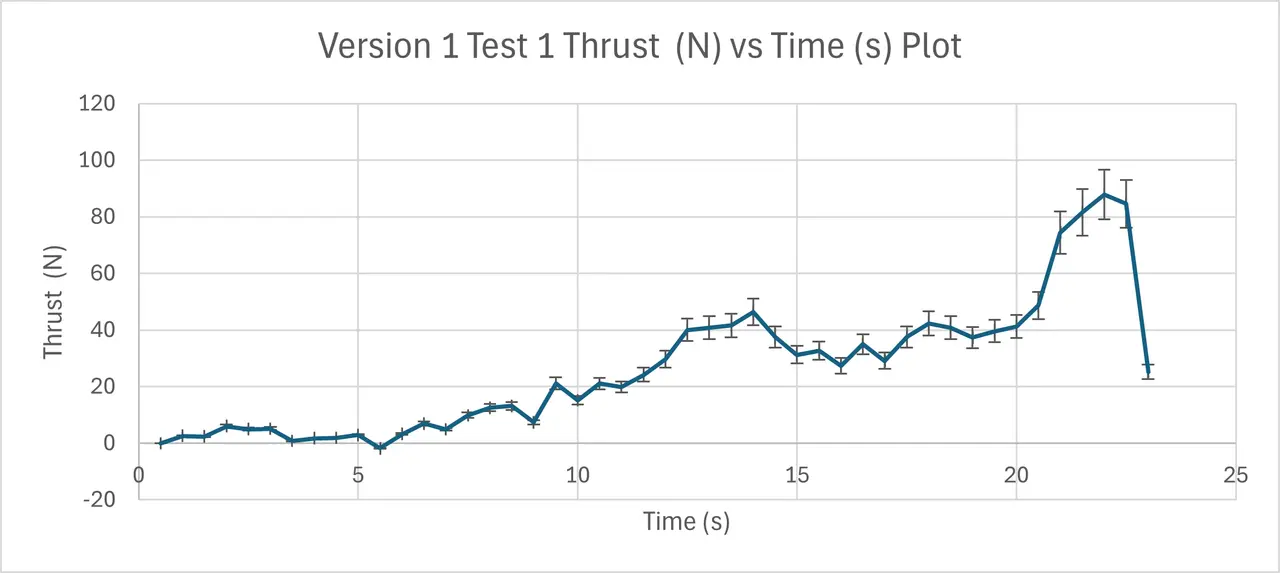
Line chart with error bars of thrust in newtons against time in seconds, rising unevenly to a peak near 22 seconds before dropping sharply
Thrust against time for Version 1 test 1. The run ended early when the spike supports failed as mass flow increased.
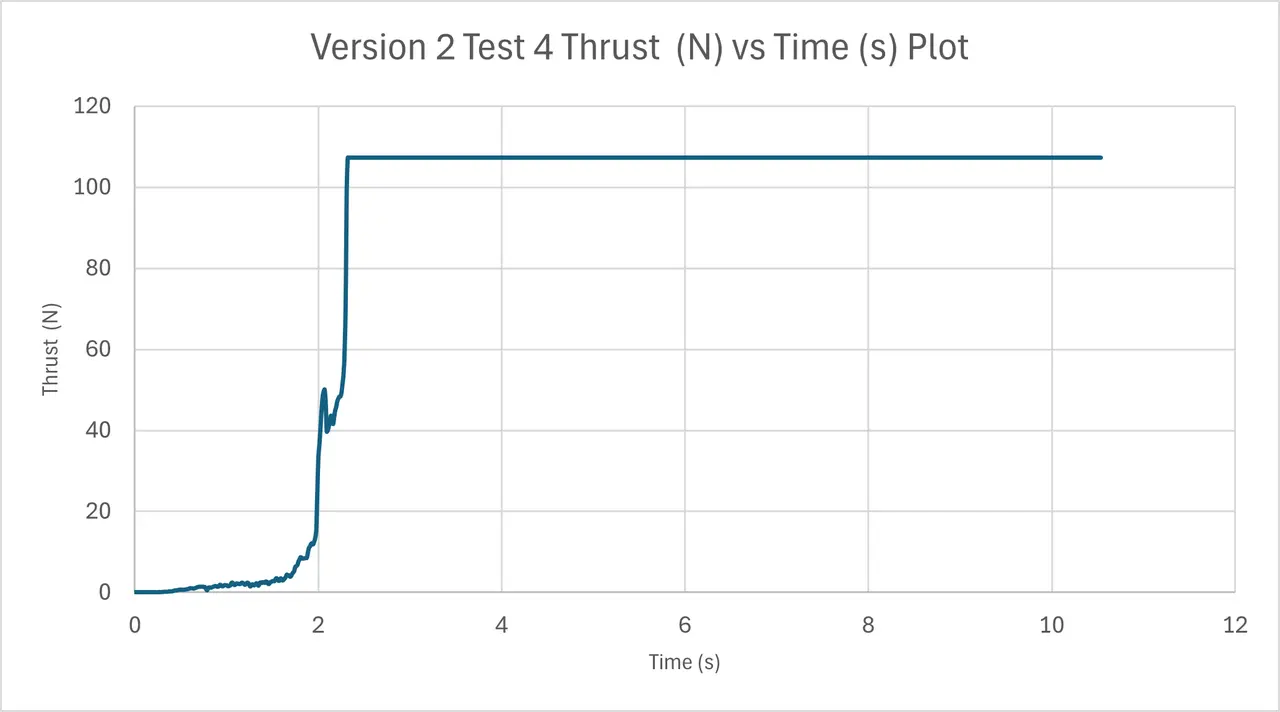
Line chart of thrust against time that climbs steeply at about two seconds and then runs flat at the top of the range for the rest of the burn
Thrust against time for Version 2 test 4. The flat top is data acquisition saturation, so the plateau is only a lower bound on peak thrust.
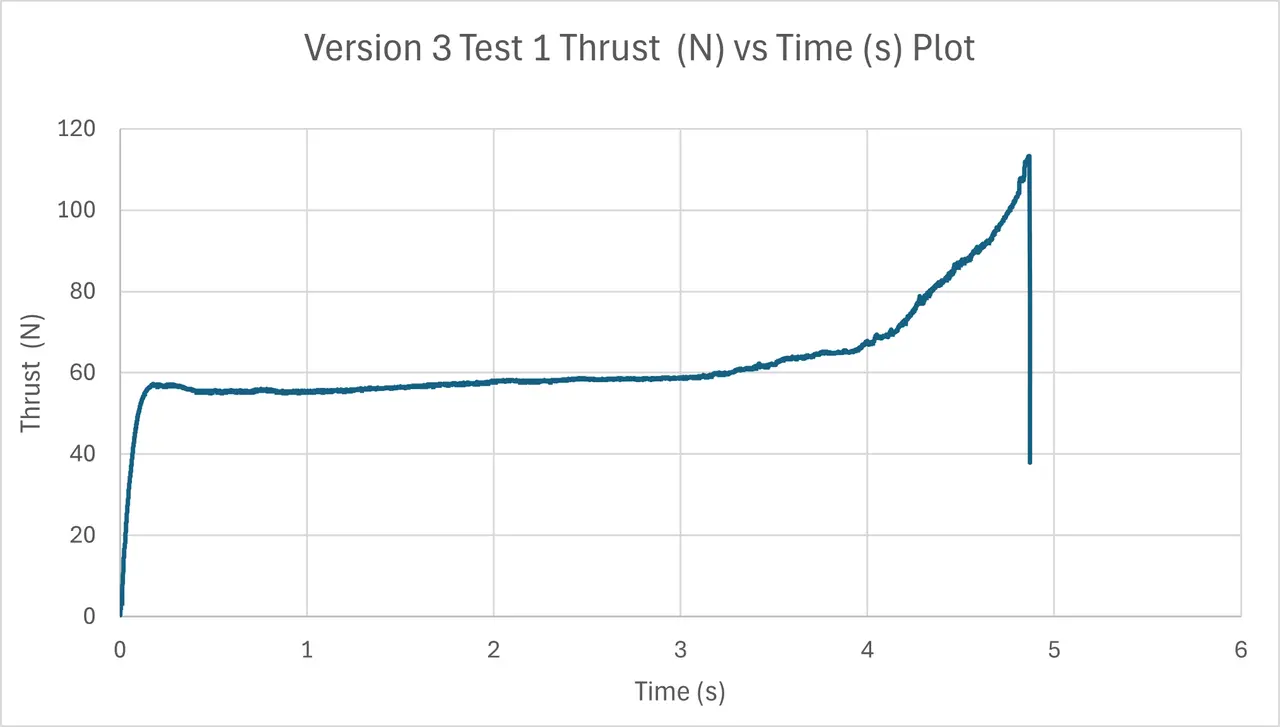
Line chart of thrust against time holding near 55 newtons for several seconds, then climbing steeply to a sharp peak at about 4.9 seconds
Thrust against time for Version 3 test 1. The trace ends when propellant flow was shut off after the mid-test hard-start event.
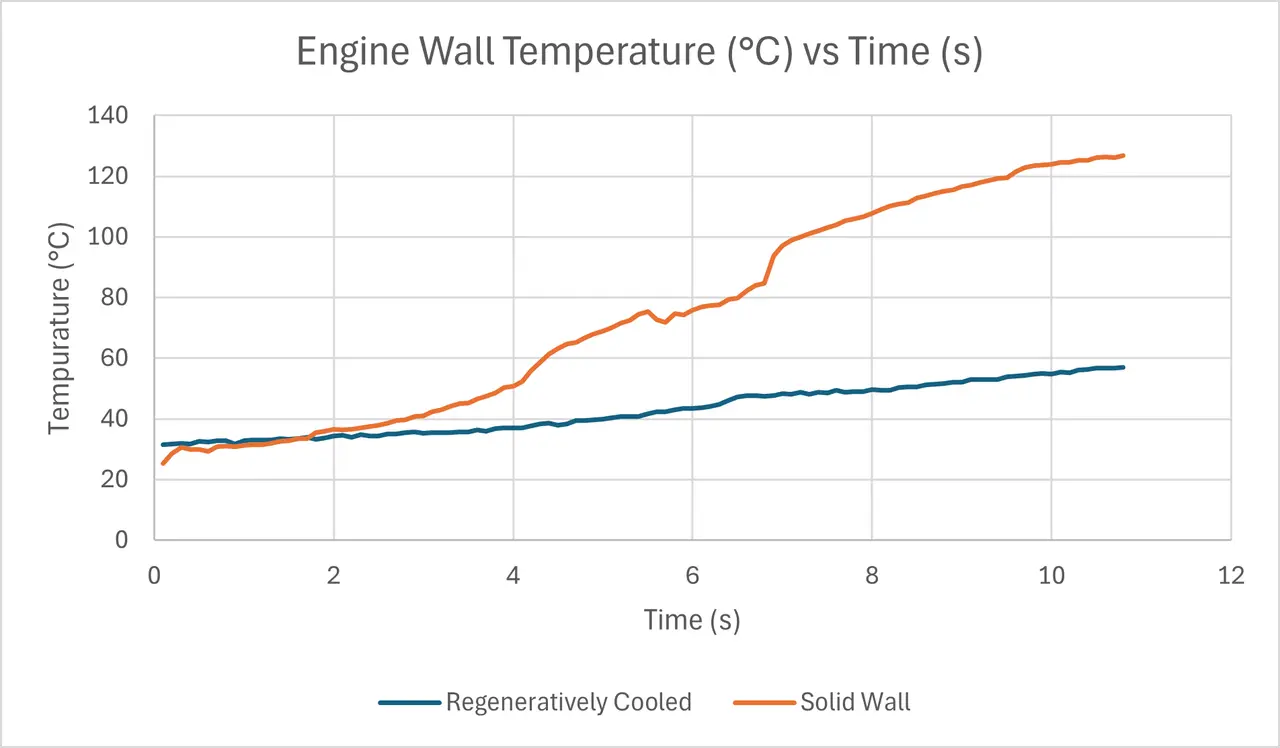
Line chart of engine wall temperature in degrees Celsius against time with a blue cooled curve staying low and an orange solid wall curve climbing much higher
Wall temperature against time for the regeneratively cooled and solid-wall sections of the engine at equivalent thickness during a hot-fire test.
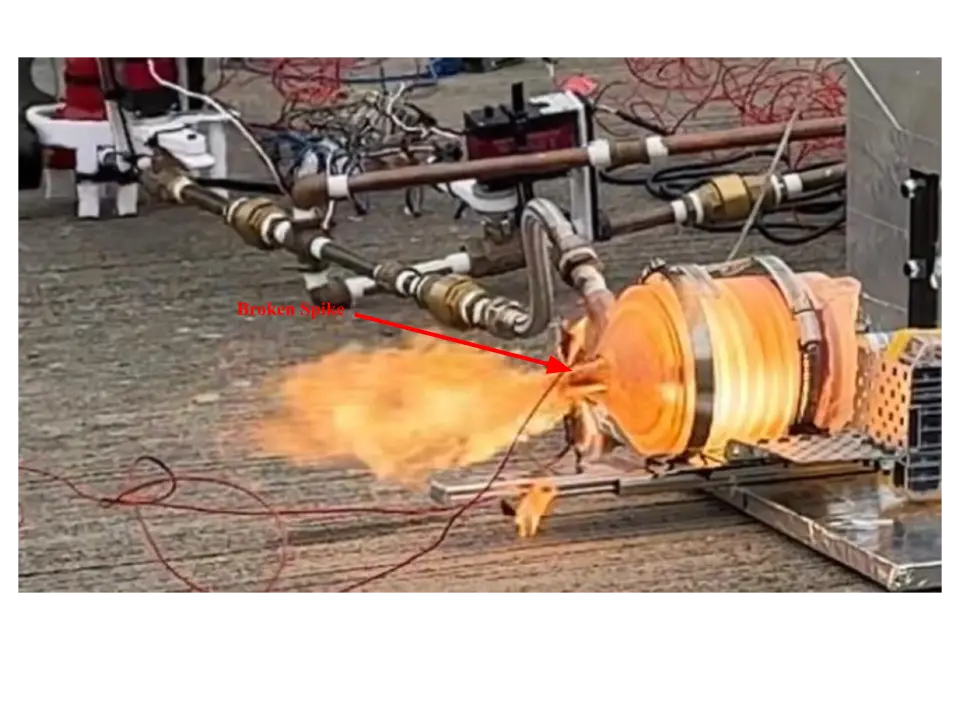
Hot-fire still with a red arrow labeled Broken Spike pointing at the nozzle end of a glowing engine while orange flame blows sideways
Hot-fire frame of the Version 1 engine at the moment the spike supports failed, annotated with the failure location.
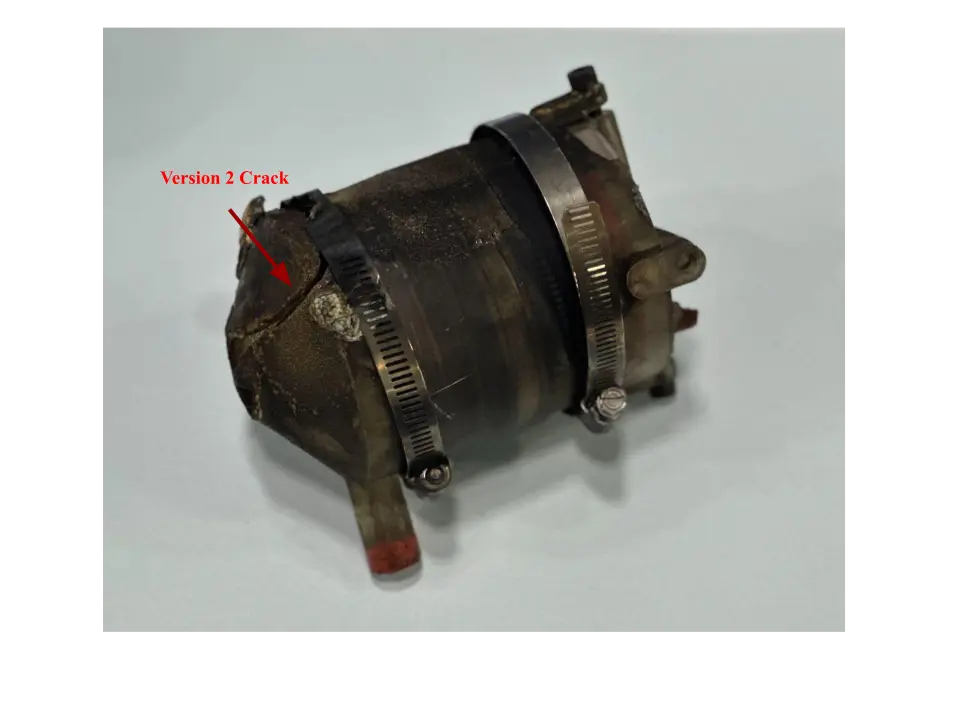
Scorched resin engine on a light surface held by two hose clamps with a red arrow labeled Version 2 Crack pointing at a split near the nozzle
The Version 2 engine after testing, with the crack in the uncooled throat section marked.
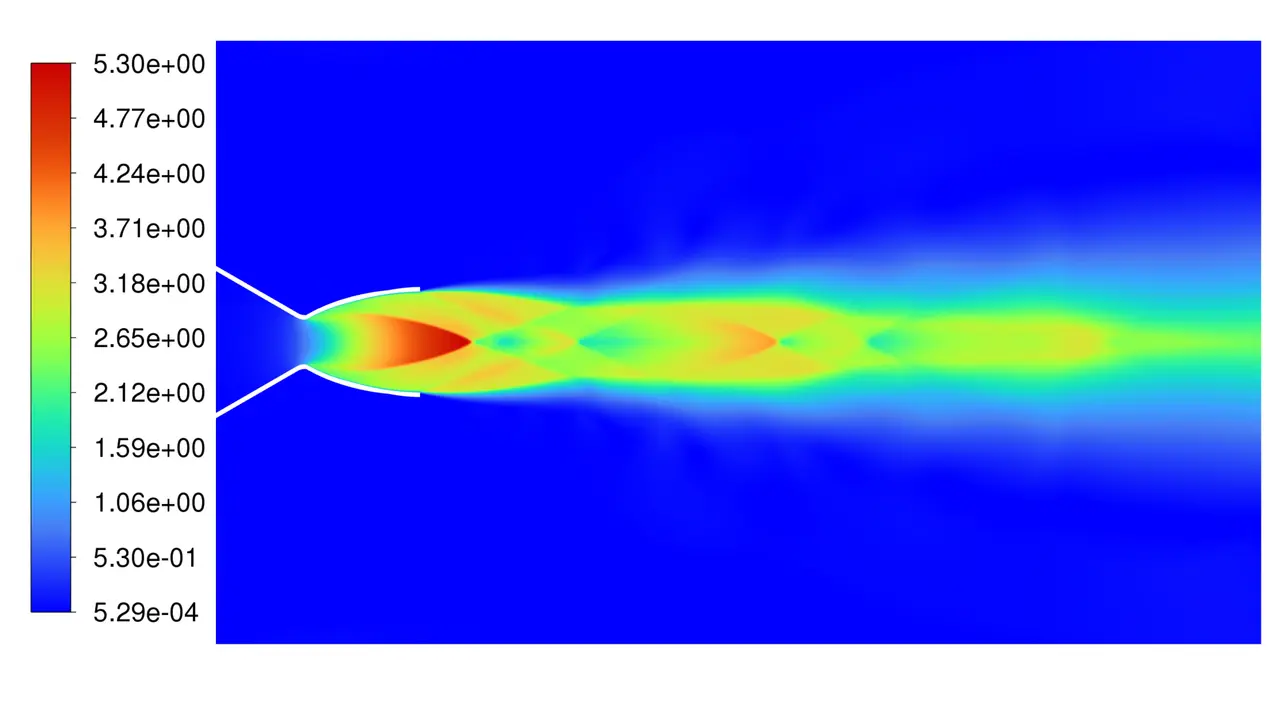
Rainbow Mach number contour of a converging-diverging nozzle exhaust with a red core and repeating diamond shock cells fading into a long plume
Mach number contours of the 1 kN hybrid engine nozzle at sea-level ambient pressure, showing the shock diamond pattern in the plume.
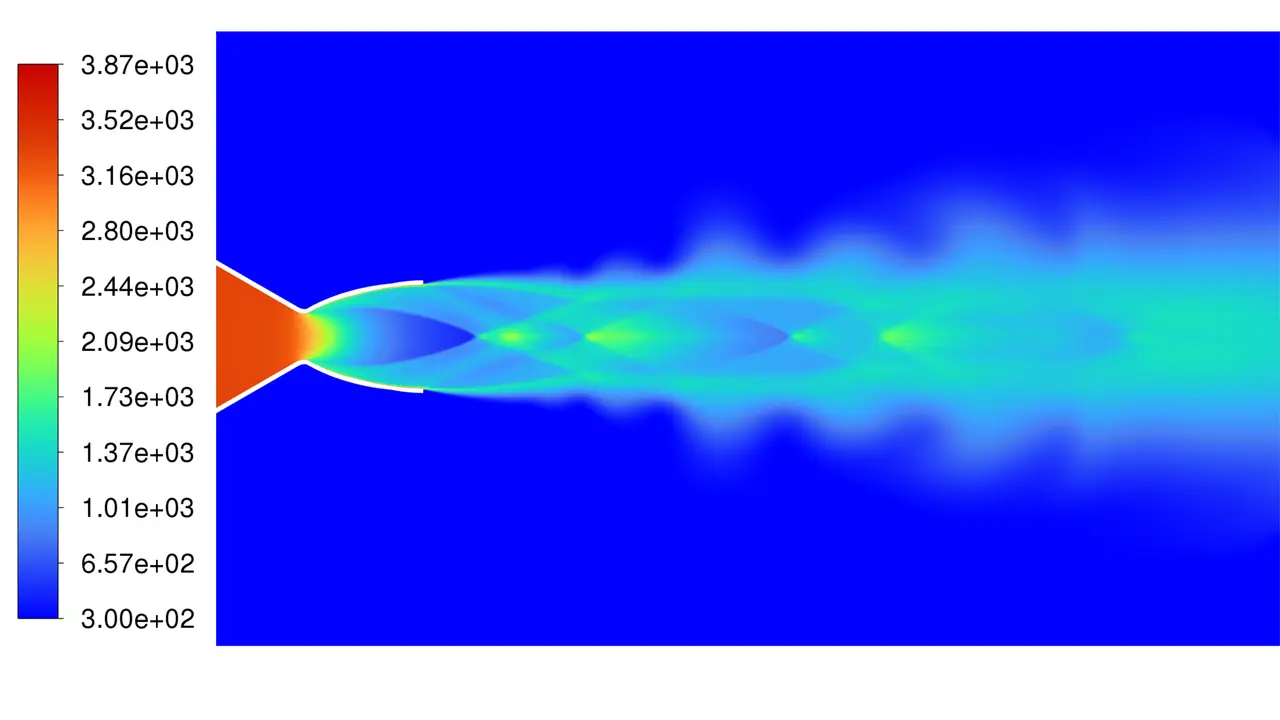
Rainbow static temperature contour of a nozzle exhaust, hot orange gas in the chamber cooling to blue and green with diamond shock cells in the plume
Static temperature contours of the 1 kN hybrid engine nozzle at sea-level ambient pressure, from hot chamber gas to the cooled exhaust plume.
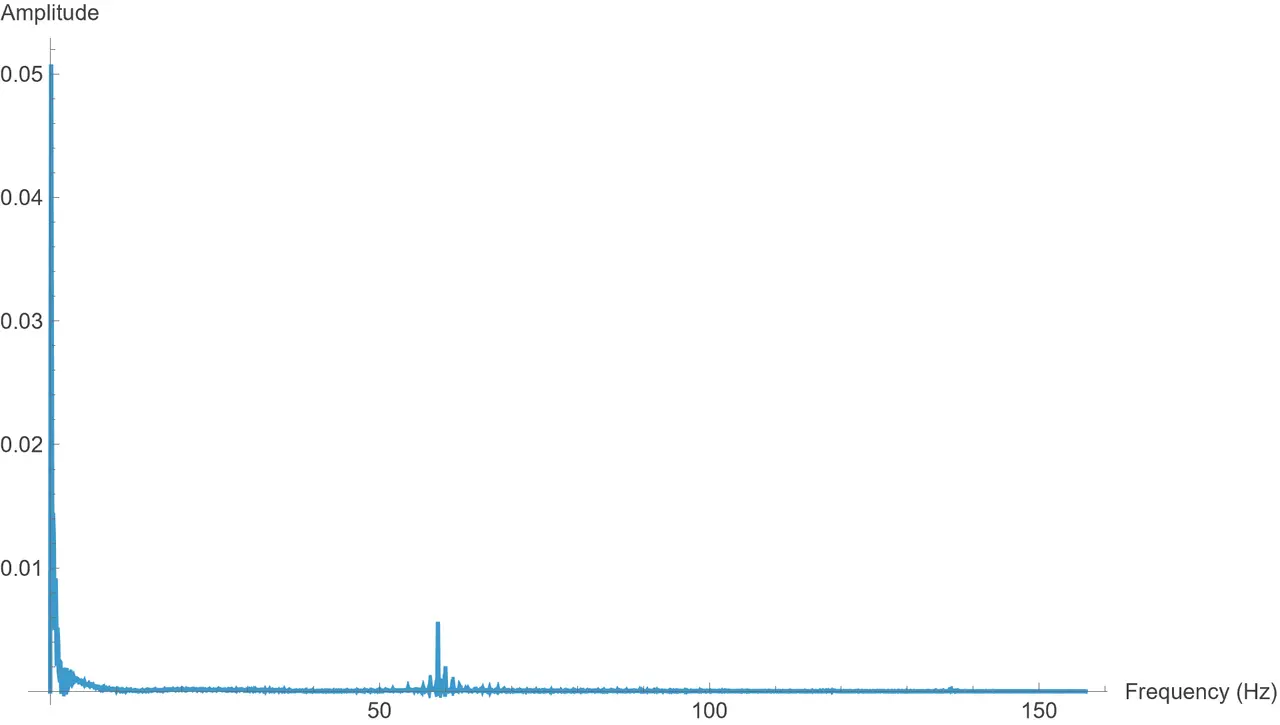
Line chart of amplitude against frequency in hertz with a tall spike at zero frequency and a small isolated peak just under 60 hertz
Frequency spectrum (fast Fourier transform) of a full-flow test thrust signal, used to identify noise in the measurement.
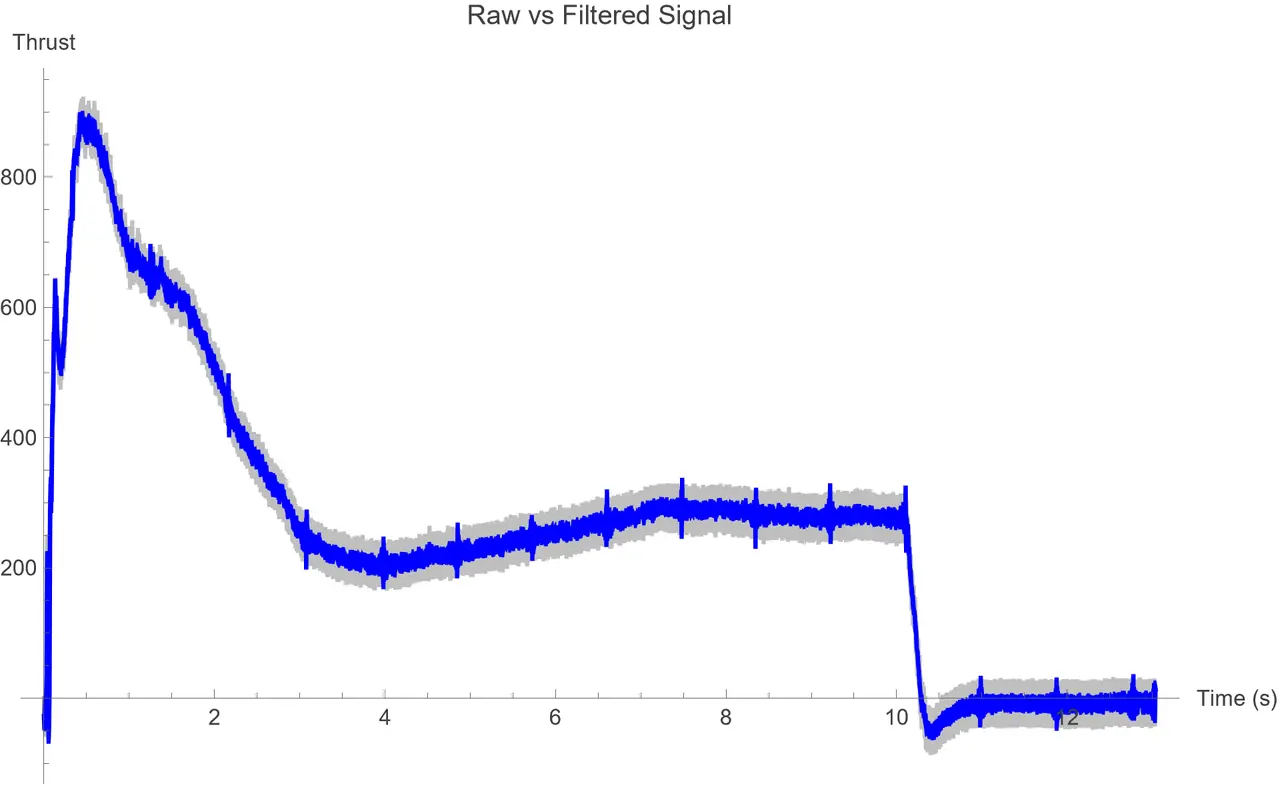
Line chart titled Raw vs Filtered Signal with thrust against time in seconds, a grey raw band under a blue filtered curve peaking early then settling
Thrust against time for a static-fire test, with the raw signal in grey and the filtered signal in blue.
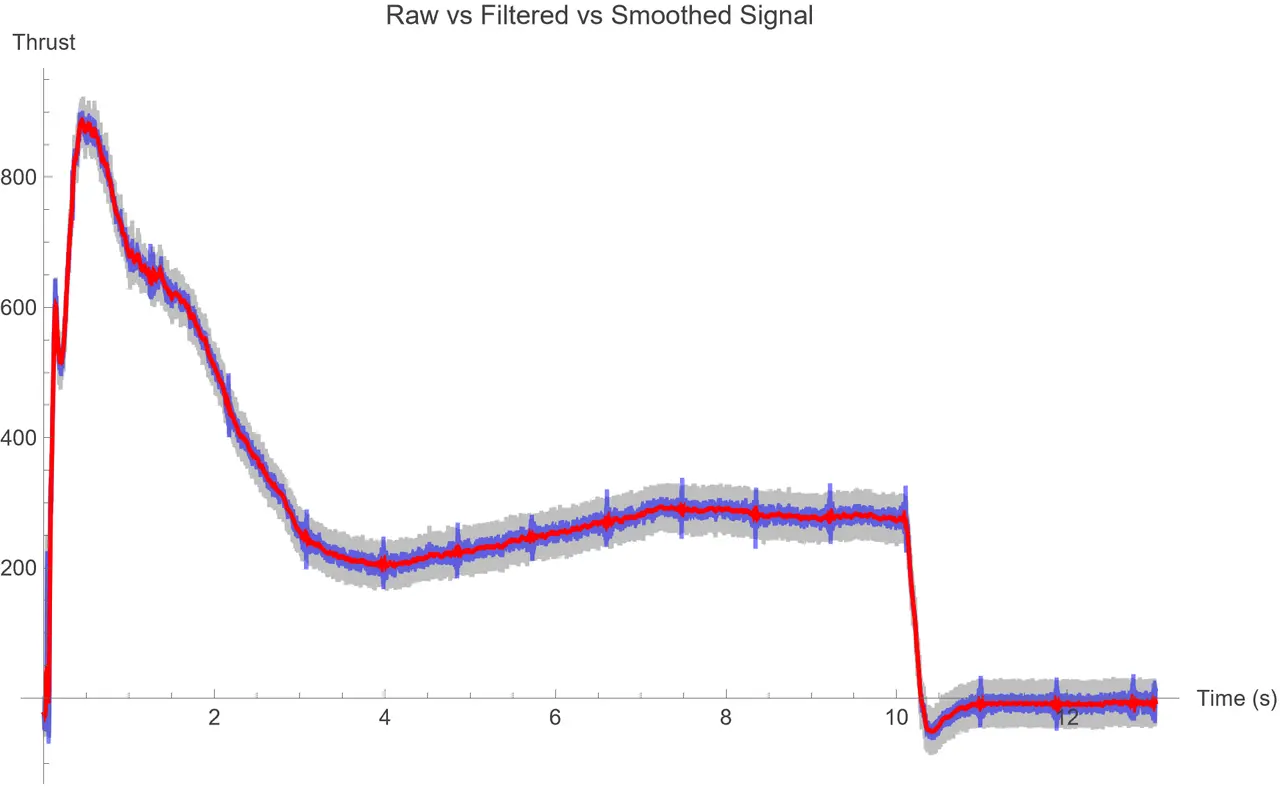
Line chart titled Raw vs Filtered vs Smoothed Signal with a red smoothed curve drawn over a blue filtered trace and a grey raw band
Thrust against time for the same static-fire test, with the raw, filtered and smoothed signals overlaid.
06 / Controls
Light band

Neutral chrome. Color comes from the work.

Interface colors stay neutral so flame, CFD contours and hot-fire footage carry all the color.